Simulation
Did you know that you are equipped with a simulation tool? Process Modeler for Microsoft Visio let’s you simulate your modelled processes easily using a practical simulation function.
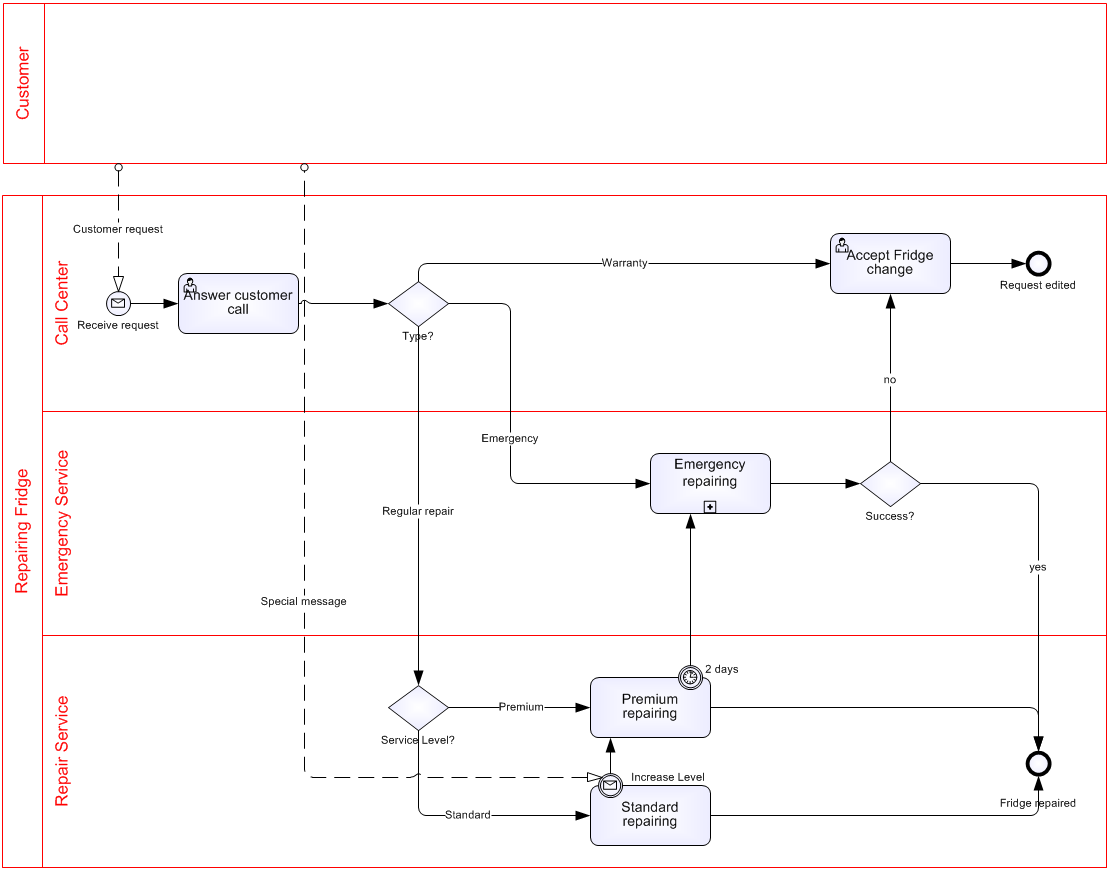
Sample Process – Repairing a Fridge
figure 1: sample process
- Process starts with the request to the call center. The repair center responds to the request and decides if it is a case of emergency, standard or guarantee.
- There are three roles: call center (24hrs a day), emergency service (24hrs a day) and a repair service available from 8am to 6pm.
- Call center staff handles incoming calls and the guarantee cases. Answering the requests is their highest priority.
- Emergency requests take approximately 2 to 5 hours. On average a standard case takes 8 hours. Standard cases from normal clients and clients with priority will be handled through a standard service company. If requests from clients with priority are not handled within 2 hours the service is changed into an emergency case.
- Some normal cases are handled with priority through special incoming messages, e.g. very impatient clients
Activities
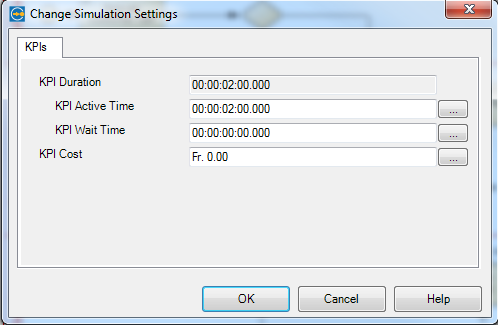
Here we do have to parameterize performing work. Work is linked to the activities. We select the activities and assign key performance indicators (KPI).
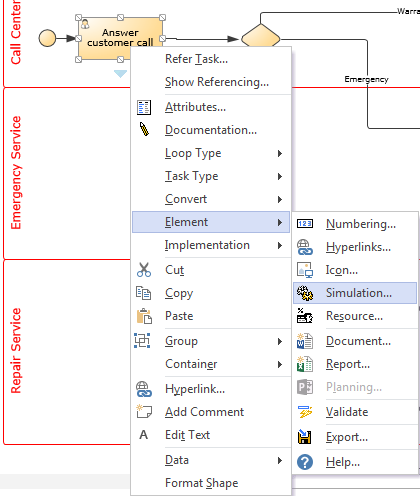
figure 5: adding KPI`s of an Activity
We do know two basic KPI`s – Waiting Time and Active Time.
Waiting Time ist the time until we start working. Activity Time ist the time we need to complete the work, in our example we need two hours.
Now we do have to allocate the resources through the function by adopting a selected activity.
Choose:
Element -> Resource
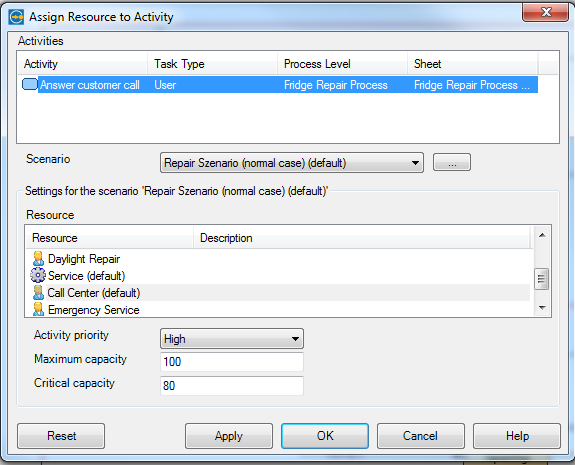
figure 7: Activity and Resource
Gateways
The function of a gateway is to split the sequence flow. To parameterize the simulation we assign probabilities to each out-bound gateway sequence flow. We can get estimated percentage values of standard cases, emergency cases or requests from our clients. We implement a statistically relevant number of running simulations e.g. 1000 process instances (service requests, repair cases).
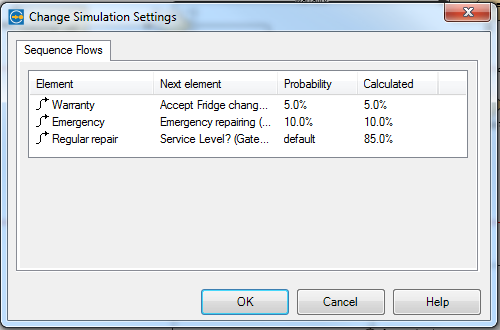
figure 8: Gateways and Gateway Parameters
Intermediate Events
Timer intermediate events follow a time cycle, which means that after a duration e.g. 4,5 hours – if the standard repair is still not completed – the repair becomes an escalation priority.
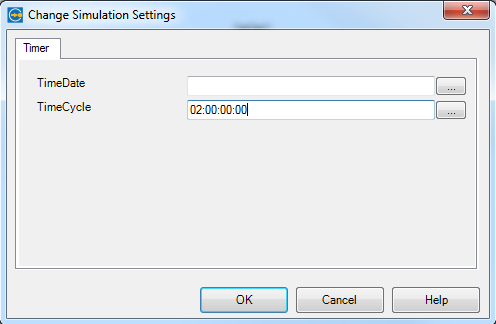
Figure 9: Timer intermediate event – time cycle
Message intermediate events get a declaration of feasibility with which something happens. We’re estimating a feasibility of 15% that an impatient or very important client rises the priority of his service request.
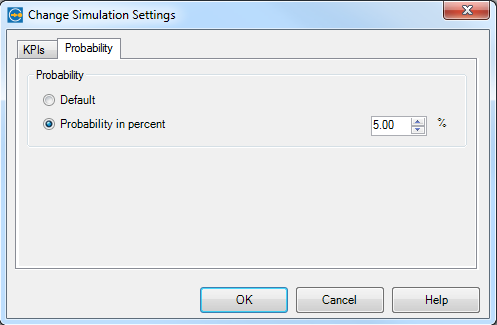
Figure 10: Feasibility of message intermediate event
Now we finished all preparations for simulating the process.
Process Simulation
Open the simulation dialogue by choosing
BPMN -> View -> Simulation
from the menu and open the tab “Controller”
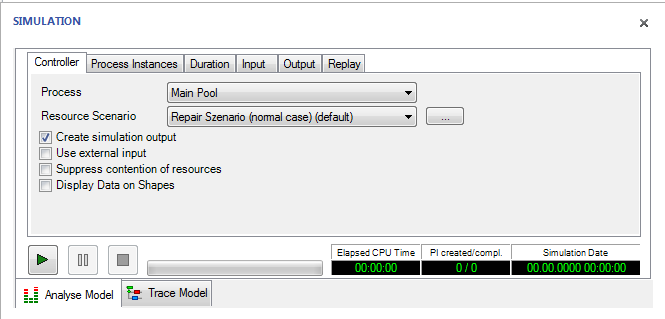
figure 11: Simulation Dialogue
With the dialogue Process-Instances/Creation Mode we are allowed to identify the number of Process Instances and the frequence.
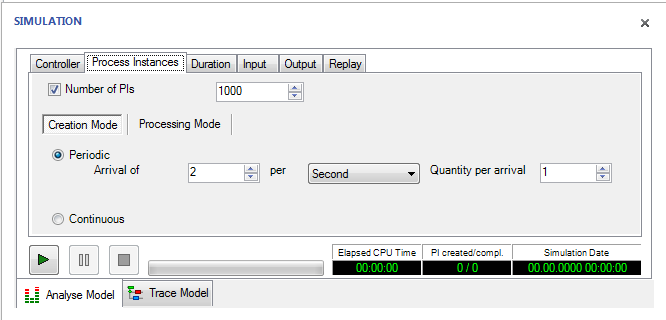
figure 12: Process Instances/Creation Mode
The dialogue Process Instances/Creation Mode can control the priority of instances if in case it comes to a bottleneck to the upstream activity.
“(FIFO) First in first out” means that Process Instances which arrives first to the activity gets priority independent of the start order.
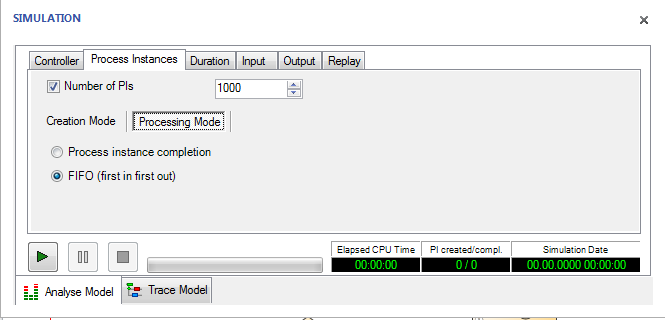
figure 13: Process Instances/Processing Mode
Dialog Process Instances allows us to fix start date/time, end date/time endtime and duration of the period.
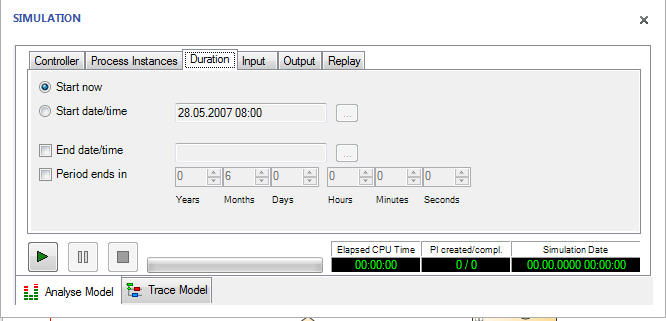 figure 14: Process Instances/Duration
The dialogue Process Instances/Output allows to define the output format of the simulation results. We recommend MS-Excel for further processing of the simulation results.
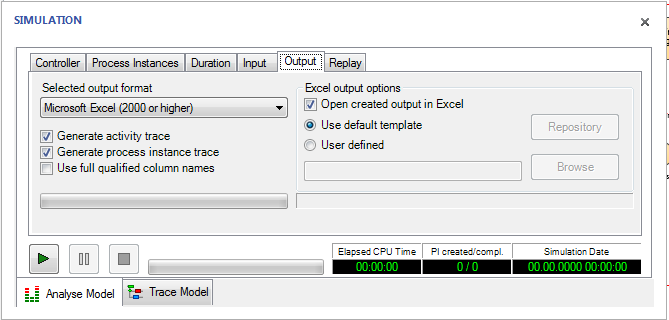
figure 15: Process Instances / Output
Pressing the green arrow on the left starts the simulation.
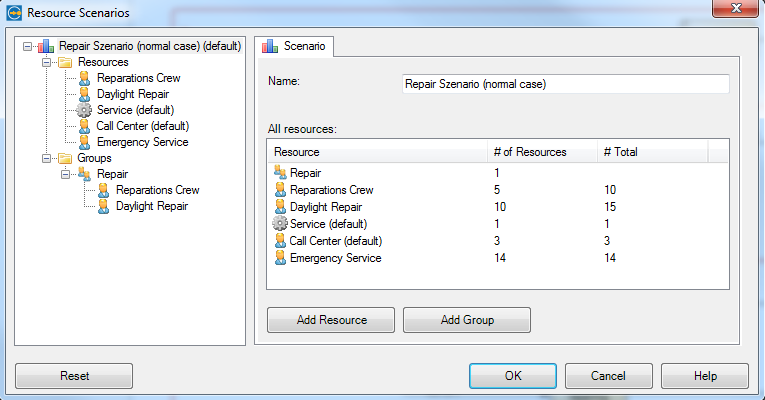
Resource Scenario
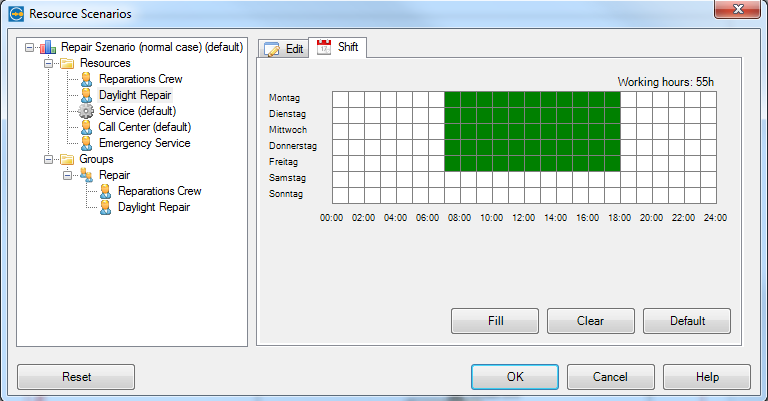
Next we have to model our available resources. Which teams are there, how many people are in the teams? What is the price for a working hour or application (means automized activity)? What is the work schedule of the team? (day shift, night shift, weekend, part-time)
To apply the resource scenario choose:
BPMN MODEL -> Resource Scenario
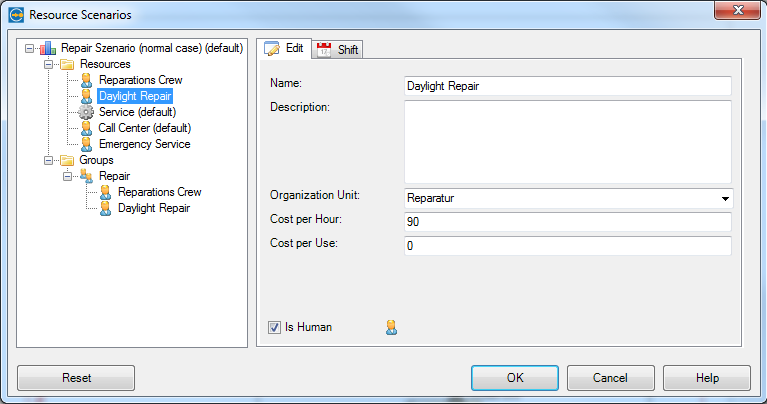
Add one of these resources (daylight repair). If it is a person add the price for a working hour.
Beside the costs we have to add working times. Here we add the calender of the daylight repair resource.
Simulation parameters
Befor we can simulate a process’ performance we need to define some parameters. How long does it take to perform an activity? How long is the waiting time for a decision? Which resources do we need? How is the work to be split and which difference from standard cases will possibly occur?
Simulation Result
As a result we get an Excel file including all results and predefined diagrams. Here is an example showing the summary of the most important process indicators and a process time diagram including Cycle Time, Active Time, Resource Wait Time as a function of the process instances (1-100).
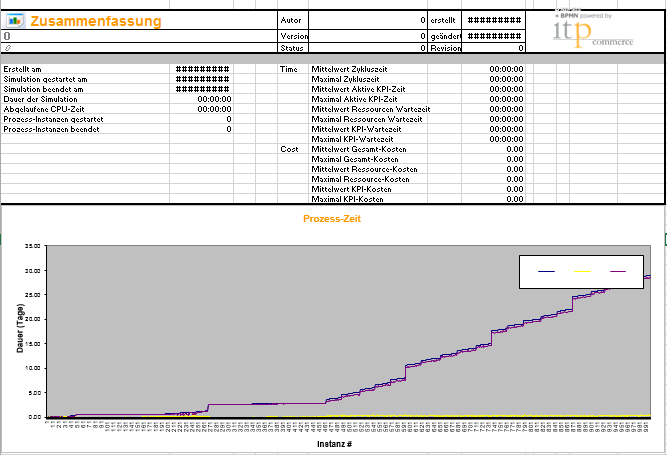
figure 16: Summary and Process Times
Another example showing the Activities, Resources, Duration, Resource Utilization and Resource Cost.
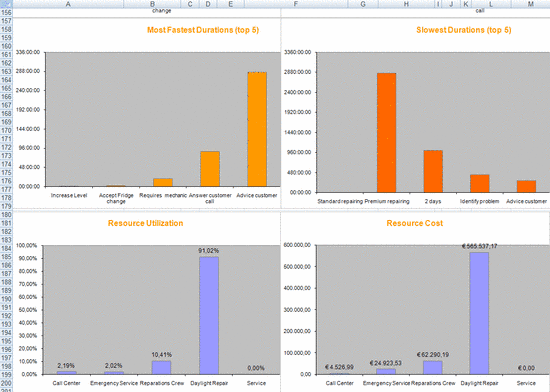
figure 17: Duration, Utilization, Cost
Be aware that there are various further statistics, indicators and diagrams possible. The shown example is only a subset and illustrates a fraction of the potential analysis.
Additionally, there is only one simulation scenario shown. You will get more benefit if you take more than one example and compare it with each other. For example the comparison between “actual process” and “target process”.


